- Private Capital Insider
- Posts
- 📈 Private Capital Worldviews: Apollo Global Management
📈 Private Capital Worldviews: Apollo Global Management
Unpacking the strategy behind the world’s largest alts manager
Jake @ Equifund
March 20, 2024
Last month, we made the decision to start providing more coverage on the major, publicly traded, private equity firms.
Why? According to Pitchbook,
All seven public PE managers are cultivating perpetual capital franchises and seek to benefit from the compelling economics of the model.
The unlimited duration of perpetual capital funds removes the pressure to sell assets within a fixed period, increasing flexibility and enabling a more consistent revenue stream of performance fees.
Said another way, all seven firms have eyes on the profit potential that comes from expanding access to retail investors (and charging fees for the privilege).
We’ve already covered KKR and Blackstone…
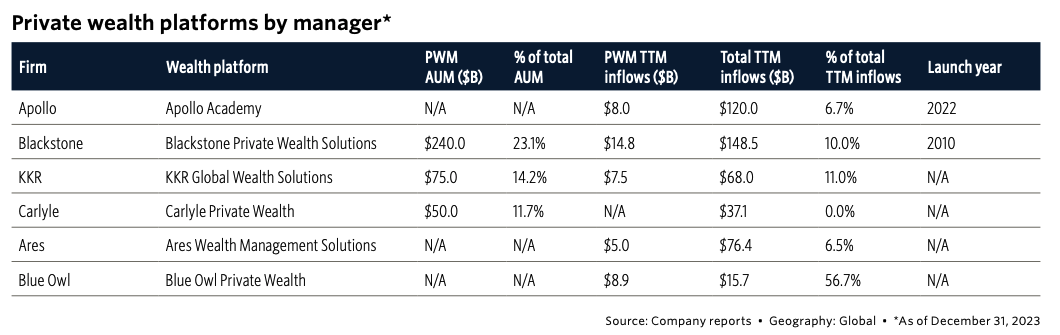
Today, we’re diving into Apollo Global Management and their efforts to win market share via the Apollo Academy.
Let’s dive in,
-Jake Hoffberg
P.S Looking for back issues of Private Capital Insider?
A Brief History of Apollo
Founded in 1990 by three partners – Leon Black, Joshua Harris, and Marc Rowan – the Apollo Global Management’s initial focus was on distressed debt.

Leon Black, left, founded Apollo Global Management in 1990 with Joshua Harris, right, and Marc Rowan, center.
While there is no shortage of drama surrounding the firm – especially with its ties to Jeffrey Epstein – Apollo has been involved in some of the largest leveraged buyouts in history.
But to get us up to speed on today’s topic, let’s do a quick overview of some key dates in Apollo’s history:
In 2009, the firm launched Athene, with aspirations to become a leading retirement services company.
In 2011, Apollo Global Management, LLC made its initial public offering on the New York Stock Exchange, with the ticker symbol APO, further solidifying Apollo’s position as a leading global alternative asset manager.
In 2016, Athene Holding Ltd. made its initial public offering on the New York Stock Exchange under the ticker symbol ATH.
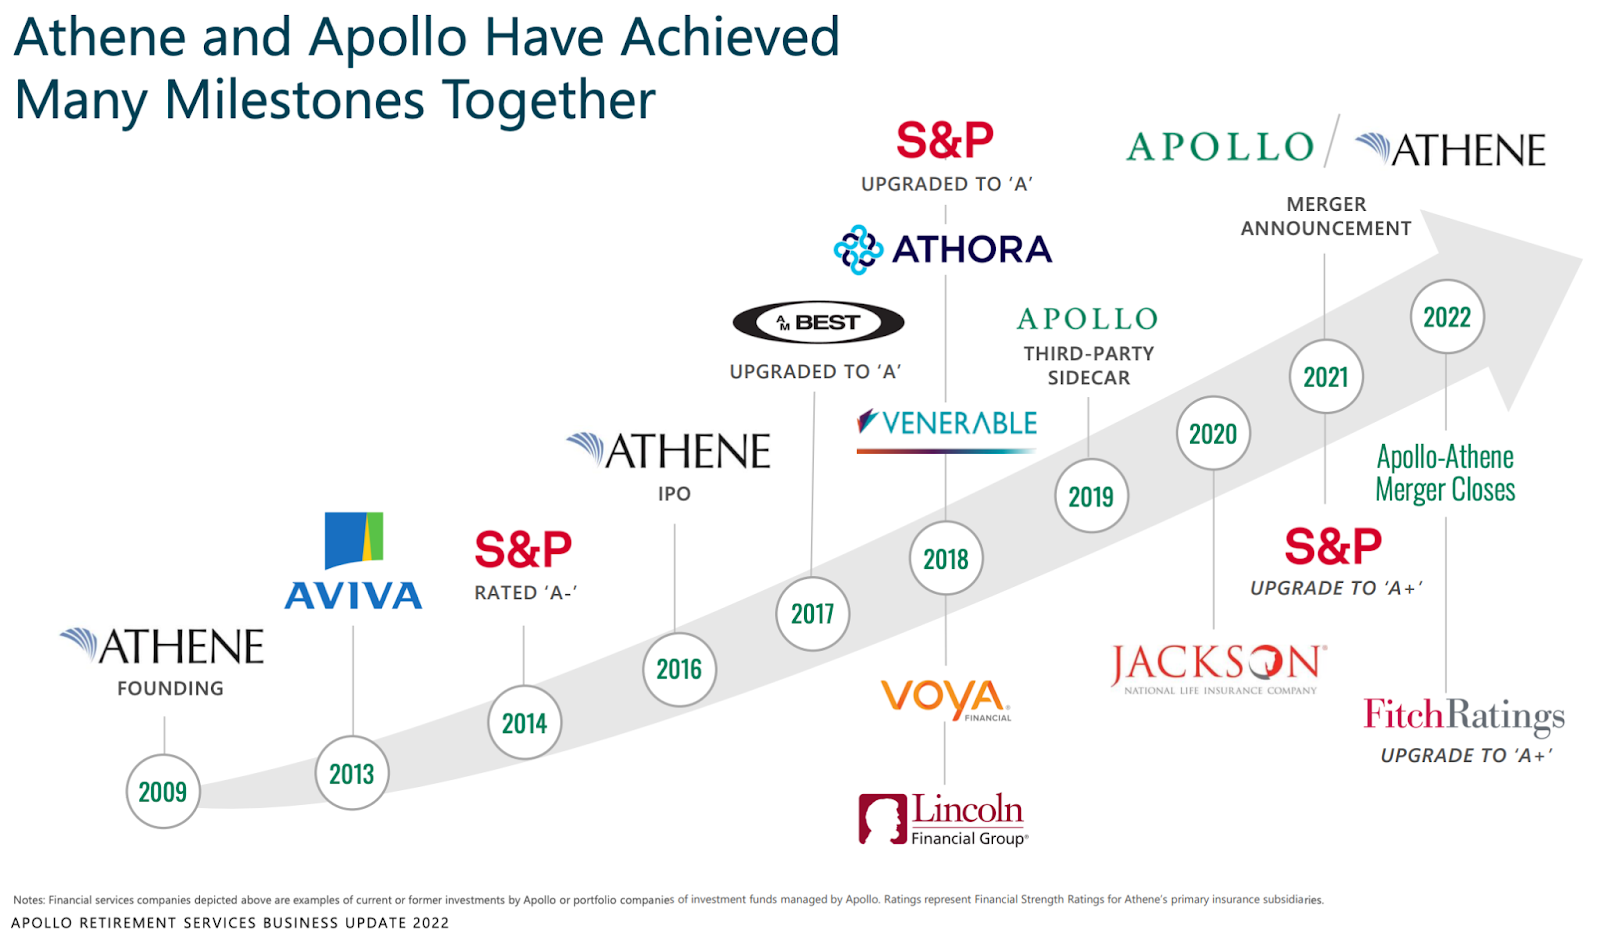
In May 2021, Apollo established its dedicated Global Wealth Management Solutions vertical within its Client and Product Solutions group, furthering the firm’s strategic imperative to better serve individual investors.
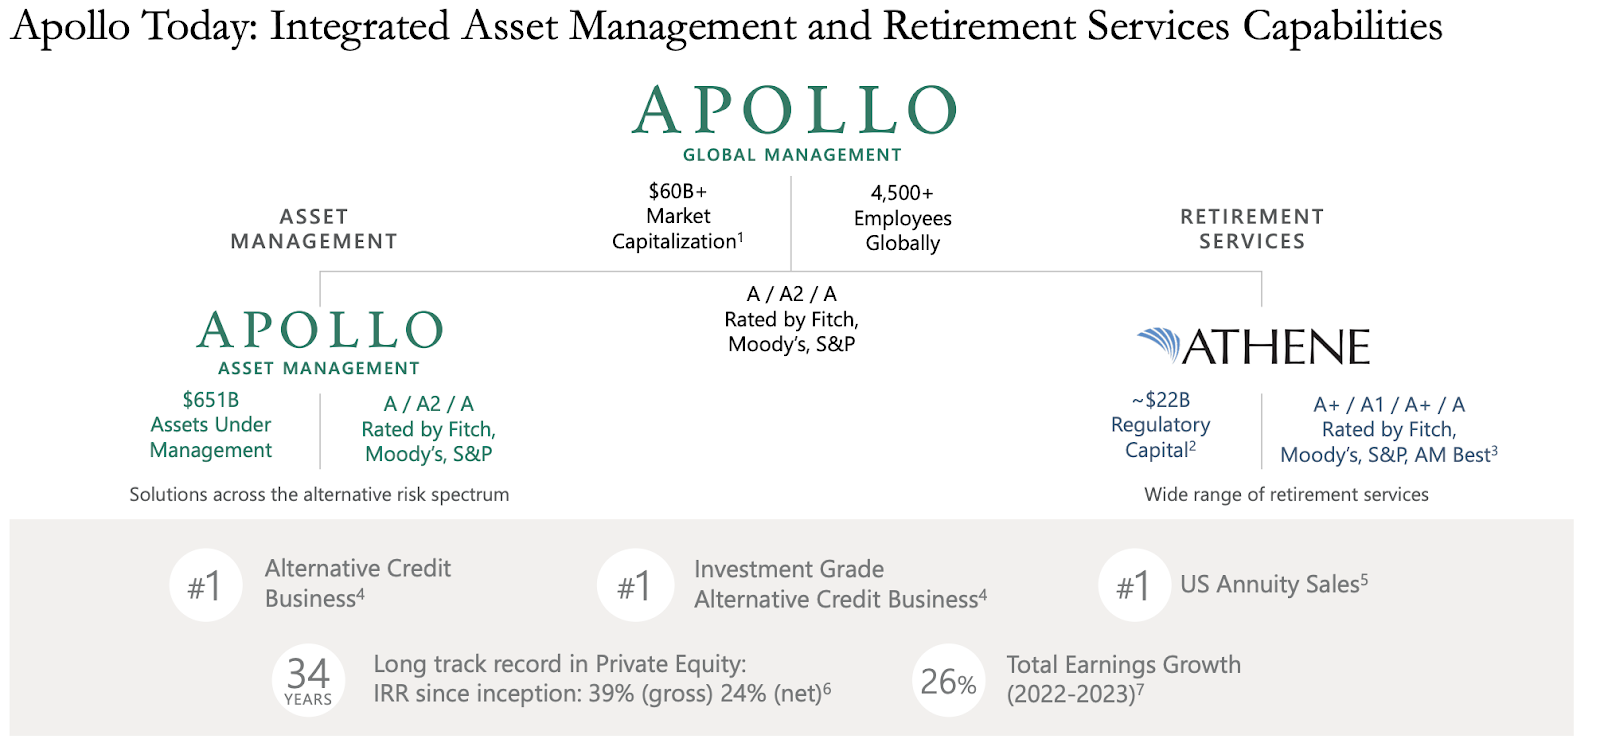
In January 2022, Apollo completed its merger with Athene, bringing the two strategic partners together in full alignment, and under one publicly-traded parent company bearing the Apollo name.
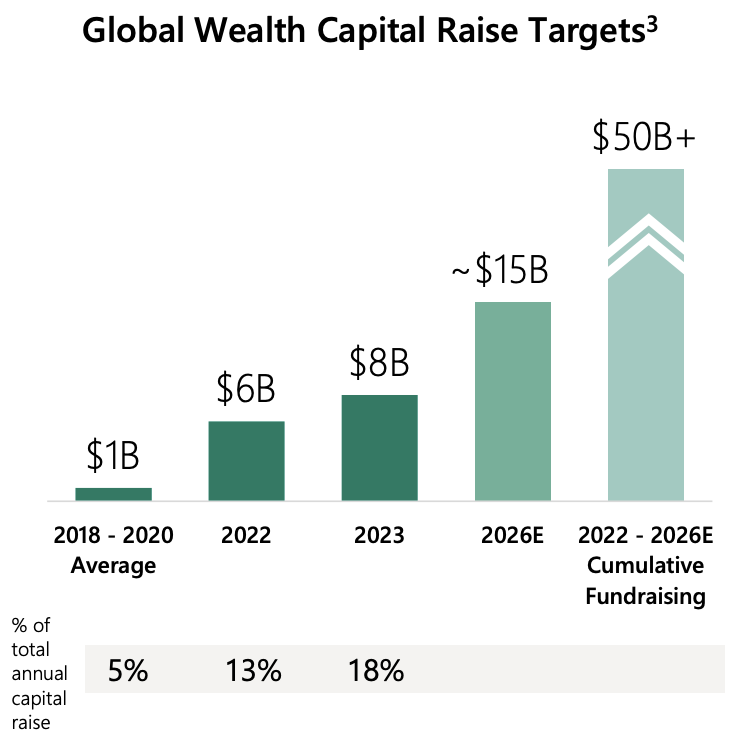
According to the firm’s Fourth Quarter and Full Year 2023 Earnings, they raised “more than $8 billion of capital during 2023 from a combination of successful product launches, ongoing distribution expansion, and continued education focused on providing solutions for individual investors”
And just like KKR and Blackstone, Apollo is putting serious resources into advisor education on alternatives – a platform broadly known as The Apollo Academy.
Why? Because the advisory channel is the main distribution channel for financial products.
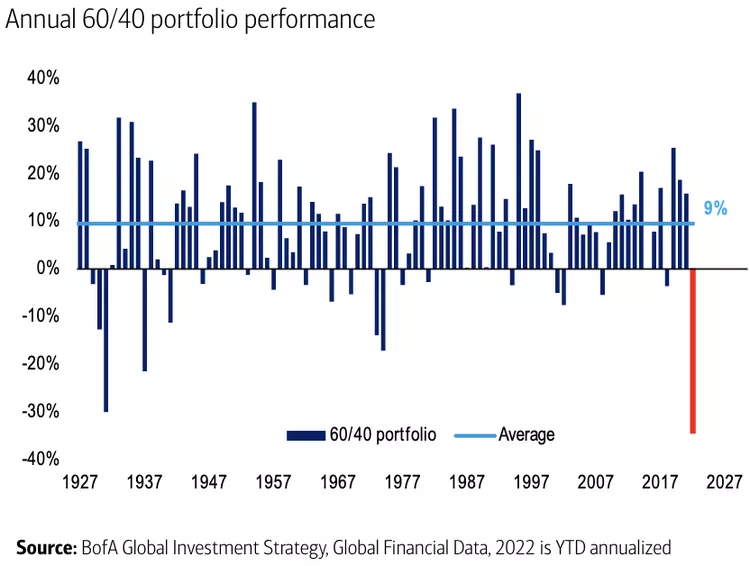
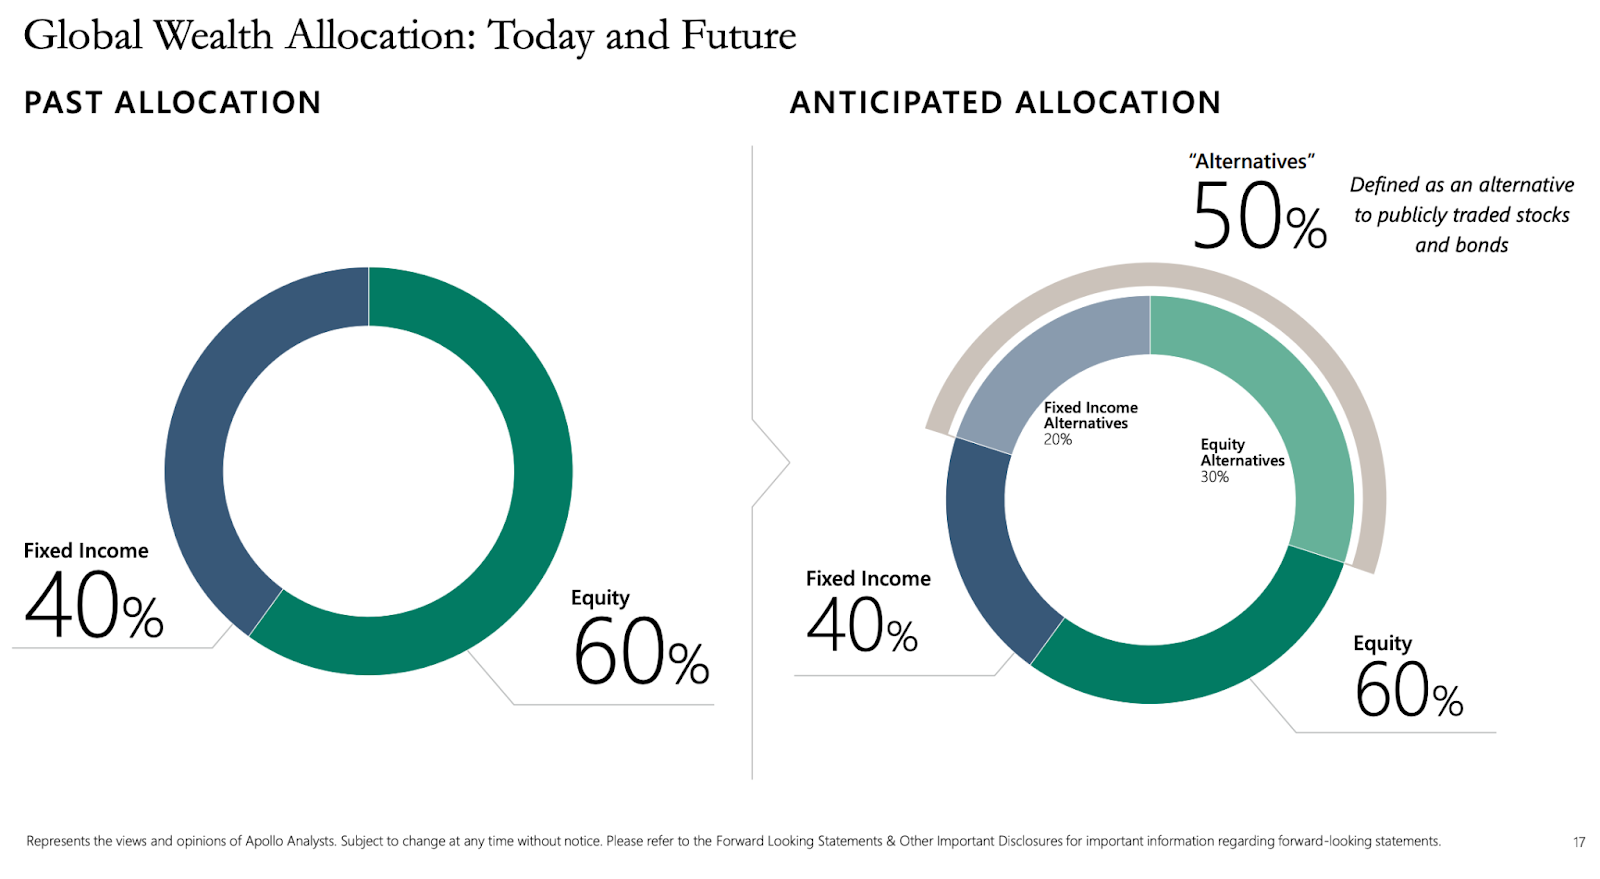
And if we take a look at the firm’s July 2022 white paper, How alternatives can address your 60/40 portfolio blues, we can see a compelling thesis around “why alternatives?” and “why now?”
Also just like KKR and Blackstone, the primary focus is on the “Just Add Alts!” narrative, and comes back to the historically weak performance of the 60/40 portfolio in 2022.
But unlike other firms that tend to focus on the more surface level aspect of performance…
Apollo dedicates a significant amount of attention to explaining why the 60/40 might not meet investor expectations going forward.
Simply put, thanks to a combination of factors, public markets today are primarily Beta, not Alpha…
Visible by the fact that a staggering 94% of active equity managers have underperformed the S&P 500 benchmark on a 20-year basis.
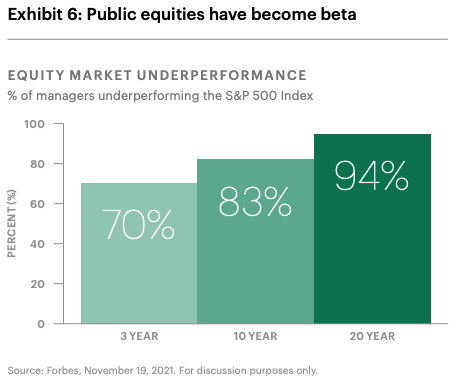
Fewer companies and higher concentration have combined to reduce the opportunity for investors to harvest excess returns in the public markets.This trend has sparked a massive flight of capital from active strategies into passive strategies.
Let’s run through those factors…
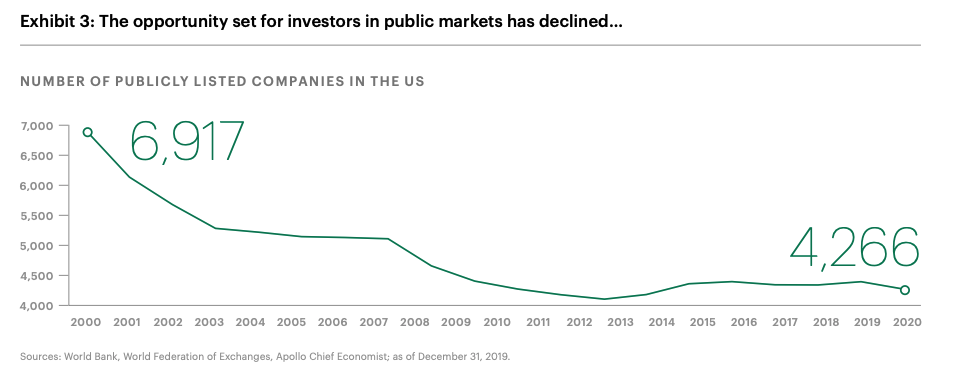
Factor #1) Fewer publicly traded securities:
Since 2000, the number of publicly traded companies in the U.S. has declined by close to 40%. Even after the IPO Boom of 21, there’s only a little over 4,200 public companies.
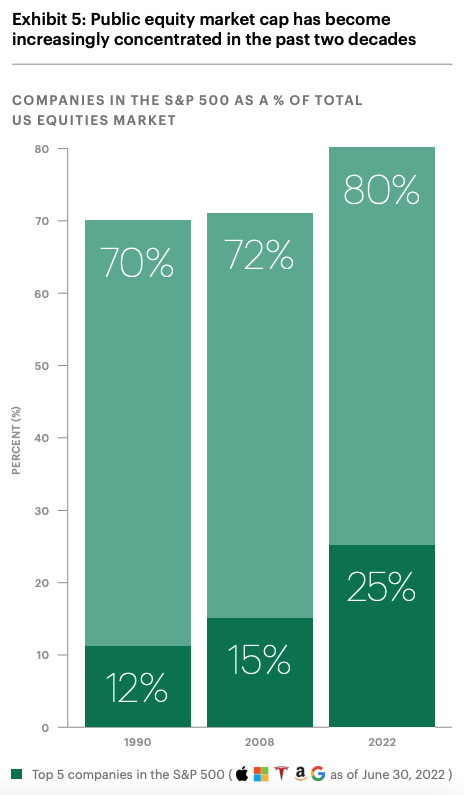
Factor #2) Increased concentration:
By mid-2022, the companies in the S&P 500 Index accounted for 80% of the U.S. equities markets, while the top five made up a quarter of the Index – compared to 12% roughly two decades ago (note: see our Feb 24th issue for an update on stock market concentration).
Factor #3) The rise of passive investing:
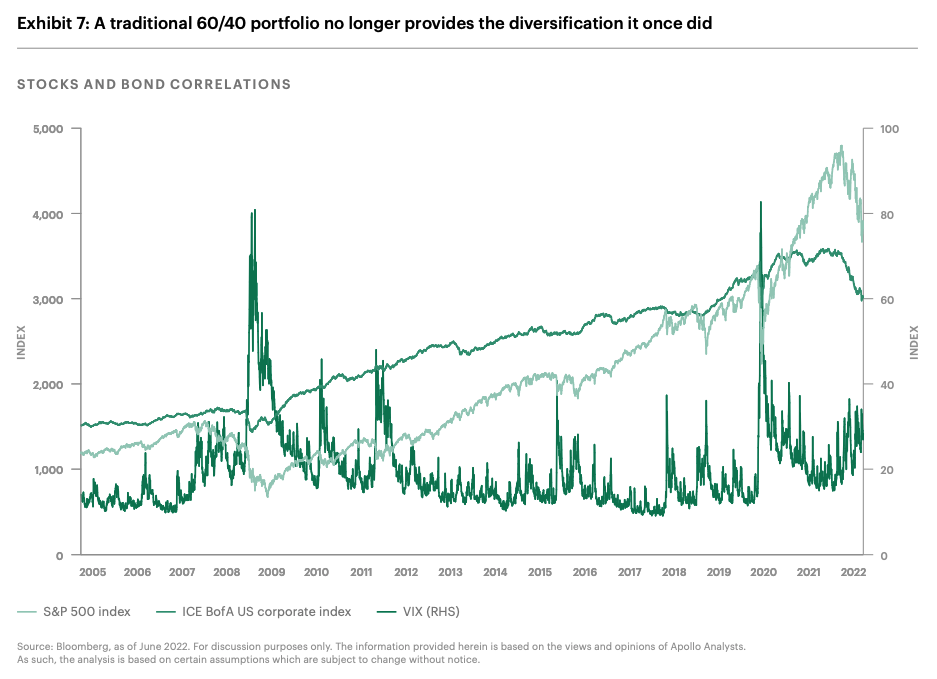
As a result of these secular changes, the correlation between public stocks and bonds has been on the rise, weakening the ability of traditional portfolios (i.e., 60% equity/40% bonds) to deliver the diversification benefits they once did.
To be fair, you could have gleaned these insights from just about any firm’s white paper on alternative assets…
But Apollo takes it a step further by discussing a topic we haven’t yet presented in Private Capital Insider – Volatility Drag.
We’ve talked plenty about the importance of reducing Fee Drag from your portfolio, as it is mathematically the easiest way to improve returns without taking on more risk…
But the other sneaky trick you’ll often find being used by those selling investment opportunities is how they present average annual returns – are they using arithmetic returns or geometric returns?
Here’s why…
When you’re using arithmetic returns, you are simply taking an average of returns over a total period of time.
But here’s the problem with using an arithmetic return…
If in Year One, you generate a 100% return… but in Year Two, you suffer a 50% loss… how much money did you make (or lose)?
If you’re using an arithmetic return, you just experienced a 25% annualized return [(100% + (-50%) / 2].
But in reality (i.e., using geometric returns), doubling your money, and then cutting it in half, means you just made a round trip – no change in value.
The difference between the two numbers is what is referred to as “Volatility Drag” – or the total impact that the deviation from average annual return creates on your portfolio.
Check out the table below for a hypothetical example of how this works:
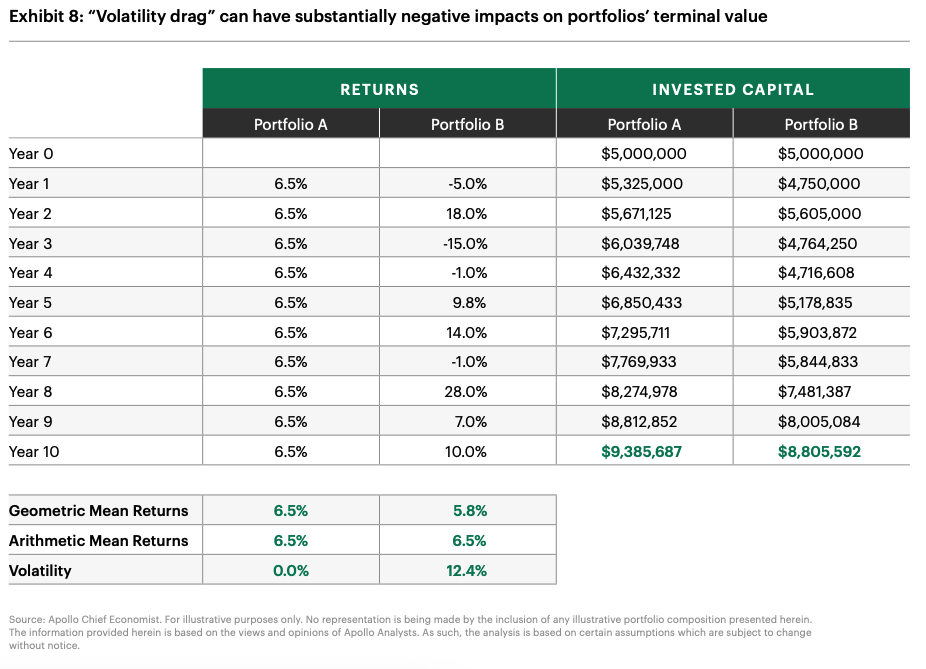
When taking the simple average of annual returns, both Portfolios A and B had similar average returns of 6.5%. Portfolio A—with stable values and zero volatility—earned a compounded return of 6.5%, while the greater volatility of Portfolio B led to a compounded annual return of 5.8%.
The end impact of that volatility is palpable: Portfolio A ended the 10-year period with a terminal value of $9.38 million while Portfolio B lagged at $8.80 million, a substantial 6.2% difference.
So remember this: whenever someone tells you something like “the public market returns, on average, 10% per year”...
That doesn’t mean you are going to get a nice, clean, consistent compounding each year.
And even though all the data suggests dollar-cost averaging into low-cost index funds is a winning strategy…
When you simply buy the market, you also have to accept the market volatility that comes with it.
In fact, a recent J.P. Morgan analysis shows that – over the past three decades – the traditional 60/40 portfolio delivered annualized returns of 9.04% with annualized volatility at 9.33%.
For this exact reason, institutional investors will often turn to asset managers to build them a product that may wind up underperforming the benchmark…
They are willing to make the trade off, if they can reduce the volatility drag.
As you’d imagine, one of the main selling points of private investments is there isn’t much observable volatility during the hold period, because of their illiquidity.
But in exchange for being locked up for a number of years, this winds up being an attractive feature for investors with longer-term horizons.
However, one of Apollo’s most compelling cases for “Why alternatives?” comes from a factor most people don’t talk about – competition.
One of the investment pillars we come back to over and over again is this: the price of any good, in any market, is a function of supply and demand.
This means that the larger the market, the more liquid it is, and the more competitive it is…
The harder it is to maintain an “information advantage” that can support Alpha.
As a point of comparison, the total market capitalization of U.S. publicly traded equities and bonds amounts to $68 trillion…
But across the global private capital markets, there’s ~$10 trillion of assets under management.
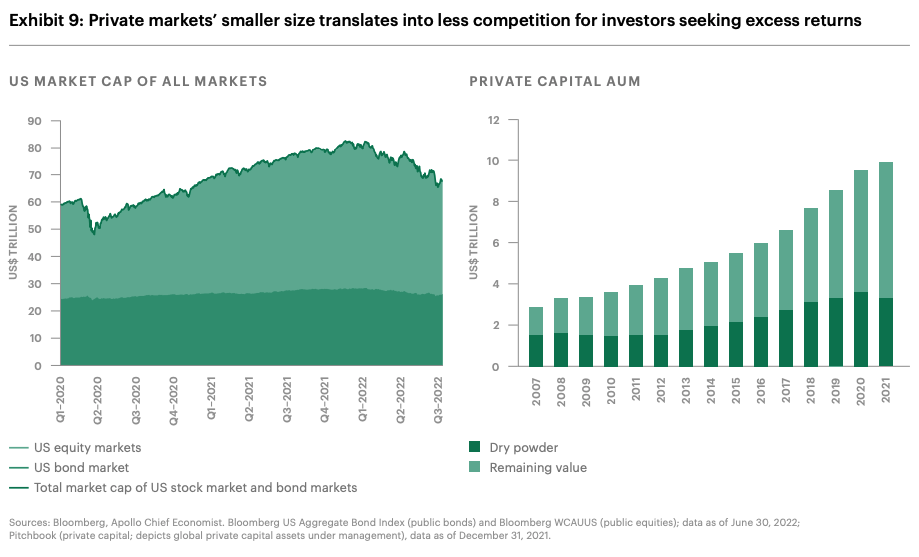
That makes U.S. public markets alone 6.8x bigger than global private markets.
Not to mention that because public markets have what is considered “perfect information,” everyone (supposedly) has simultaneous access to any information that could change price assumptions.
However, in private markets – or thinly traded public markets, for that matter – this is where smaller investors can attempt to find an information advantage that gives them an edge.
According to Apollo: Incremental additions of alternatives to this baseline 60/40 allocation, however, can dramatically change that picture, delivering potentially better returns, while also dampening volatility.
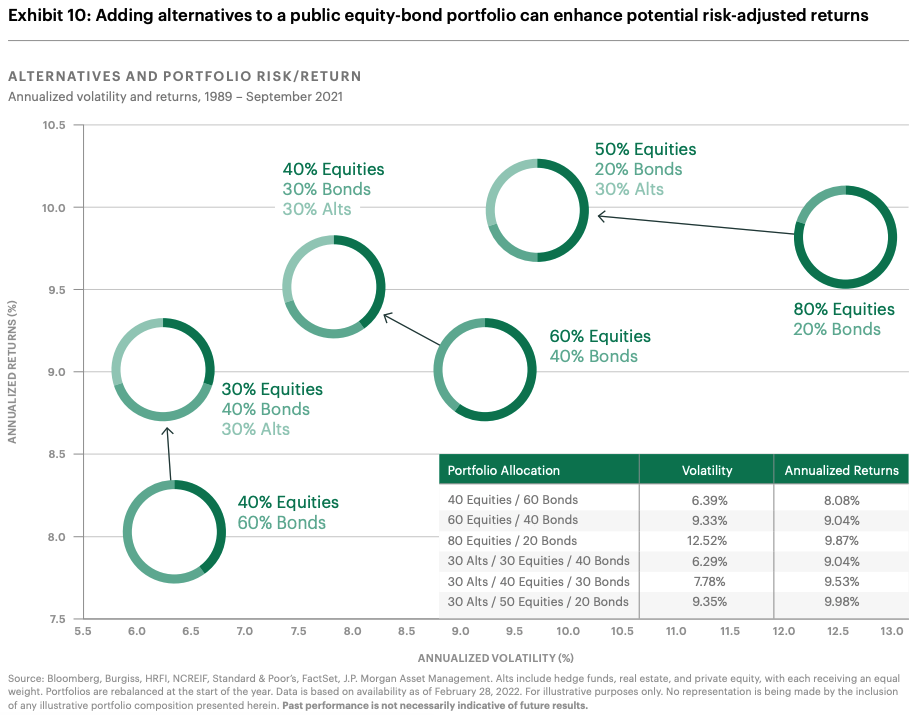
That’s why the firm’s research suggests that adding alternatives to a public-only portfolio is the key to enhancing potential risk-adjusted returns.
Please keep in mind, the lack of liquidity can make it hard for investors to find a buyer to unload a position if they need to sell. Investors must be prepared to hold onto these assets for an extended period, whereas publicly traded positions, generally speaking, can be sold on short notice.
But does this mean that YOU should add alternatives to your portfolio?
Final Thoughts: Alternatives, although attractive, have hard-to-solve problems
For all the hype around alternatives, and for most individual investors, there is a significant problem that hasn’t really gone away – access to opportunities (or at least ones comparable to those touted in research suggesting private markets outperform public markets).
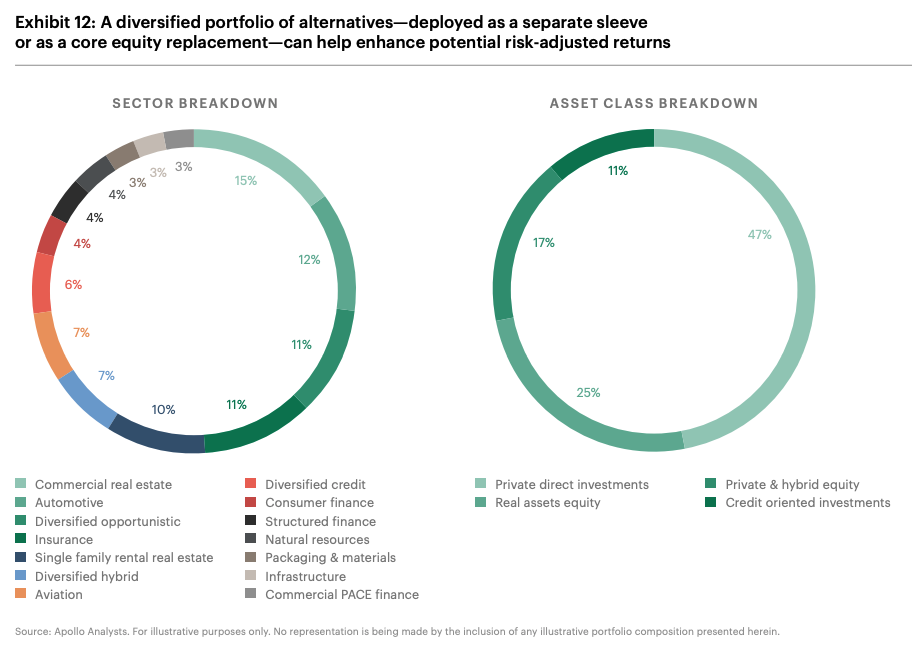
Sure, it’s all fine and good to have a fun chart that looks like this…
But where do you buy those financial products?
And even if you could, alternatives add complexity to portfolios, creating hesitancy on the part of investors (and advisors to recommend them).
Common concerns include: lack of manager alignment, illiquidity, dealing with J-Curve (where you lose a bunch of money upfront, as capital is invested before returns start to appear), capital calls, layered fees, and complex reporting...
Not to mention the complexities of diversifying across both asset classes, as well as sectors and industries.
While the JOBS Act is certainly expanding retail investor access to private markets…
We are seeing the most significant inflows of retail money going into the perpetual vehicles launched by publicly traded private equity firms like Apollo.
Sure, there’s a fee to having a name brand asset manager do it for you…
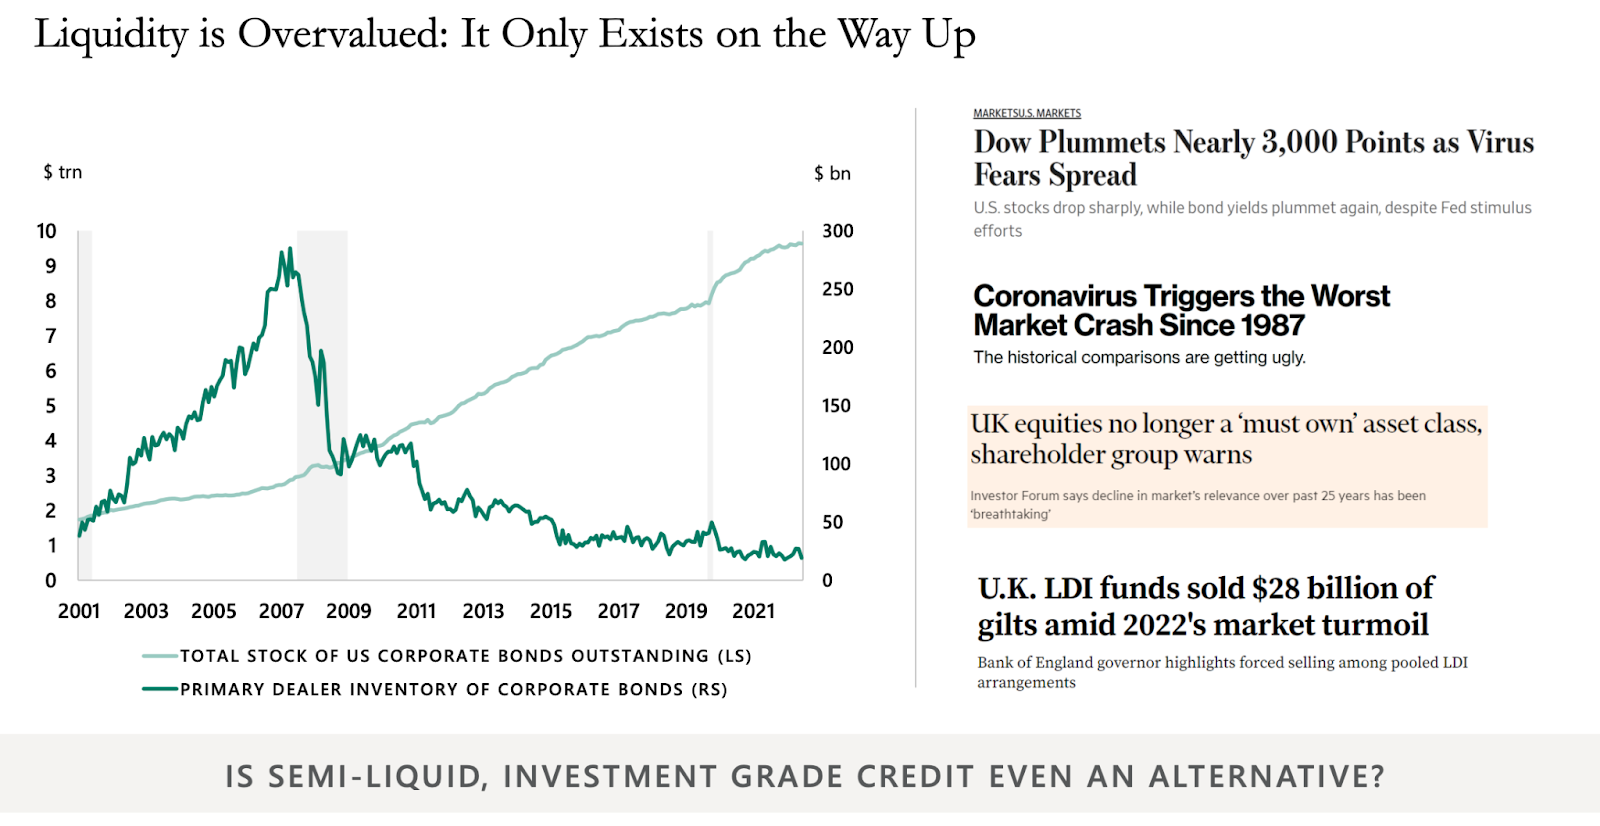
But as always, is the illiquidity fruit worth the squeeze?
Who knows? Maybe Apollo’s right: Liquidity is overvalued.
What Did You Think About Today's Issue?Select an option below and send us any feedback you have. We're always looking for input from our readers on how we can improve our editorial. |